
How accurate is our TSHD performance analysis?

In an earlier blog, we explained how we are able to do a statistical analysis of the operational performance of a trailing suction hopper dredger (TSHD). Being able to analyse the performance is important, but being able to trust the results is even more critical. In order to assess the accuracy of the algorithm we developed, we needed to do some validation. Is the algorithm capable of determining the operational performance of a TSHD? Let’s take a look.
Validation
In collaboration with a customer, we received telematics data of an 8,000m3 TSHD working on the Indian west coast. We analysed the operational performance via our statistical algorithm and compared the results with the data to see if they matched.
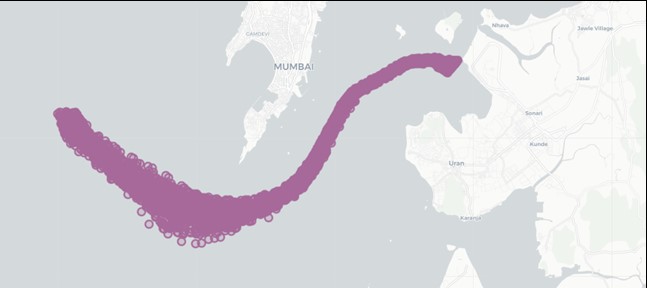
Operational activity of an 8,000m3 TSHD in the Port of Mumbai in January 2019
Our analysis covered a period of one week. During this time, both the algorithm and the vessel’s telematics data registered 37 trips. The statistical analysis resulted in an average of 247.8 minutes per trip. According to the vessel telemetry, this was 247.9 minutes. This indicates a negligible difference of 0.02% of the total cycle time. When looking more closely via a cycle-by-cycle analysis, the differences range from -1.7% to +2.8%.
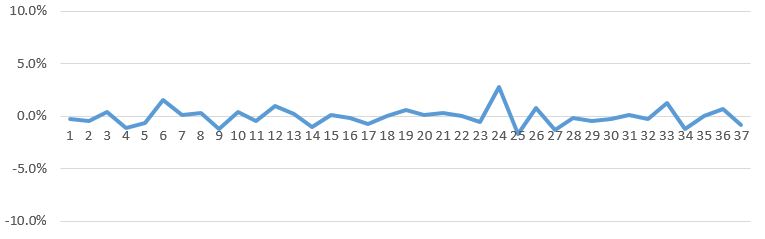 Difference per dredging trip between the statistical analysis and the vessel’s telemetry
If we take an even closer look at a state-by-state comparison between both methods, we see larger deviations. For this comparison we selected 21 trips in which the vessel was able to operate without delays. The total cycle time remains very close with just 0.2% difference. The deviations per state vary between -4.4% for sailing full to 17.7% for dumping:
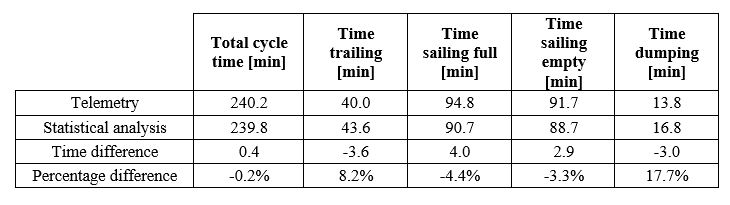
However, if we look at the actual difference in time, it is mainly between three to four minutes. Coincidently, this matches the interval in which the AIS system received updates. Generally, every three minutes a new datapoint is received. When determining the cut-off points per state, one datapoint extra leads to a difference in three minutes. This is especially noticeable on quick activities such as dumping, which is generally done in 10-20 minutes.
Conclusion
The total cycle time of the statistical analysis and the telemetry are within 2% of each other. This is above expectation based on the timing interval of the AIS data. A higher accuracy will be difficult to achieve with the current AIS frequency in mind.
The same applies when looking at the results on a state-per-state basis – we observed a deviation of, on average, three minutes. This also corresponds with the AIS frequency. However, the statistical analysis determines the state of a vessel based on location and speed, whereas the telemetry bases it on the position of the suction tube gantries, among other things. This is a different method and can also lead to differences as the suction tube is frequently being lowered while still on the approach.
Based on these results, we can confidently say that the algorithm is capable of determining the operational performance of a TSHD. This means that we can positively answer the biggest question raised in the last blog: yes, we can trust the algorithm to generate reliable and accurate results.
This leads to another question: can we create a similar algorithm for different types of equipment? Find out more in one of our upcoming blogs.
Written by
Rolf Bakker
Digital Marketeer

Want to know more about TSHD performance analysis?
Fill in the form and our experts will help you.